Click the image above for a larger version
Debugging Your JavaScript Plugin…
You can debug your JavaScript plugin and/or Property Inspector using Google Chrome’s web developer tools. In order to do so, you first need to enable the HTML remote debugger in Stream Deck.
On macOS, you will need to run the following command line in the Terminal:
defaults write com.elgato.StreamDeck html_remote_debugging_enabled -bool YES
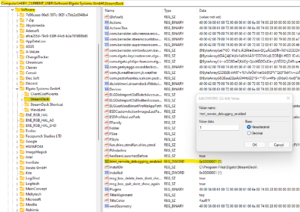
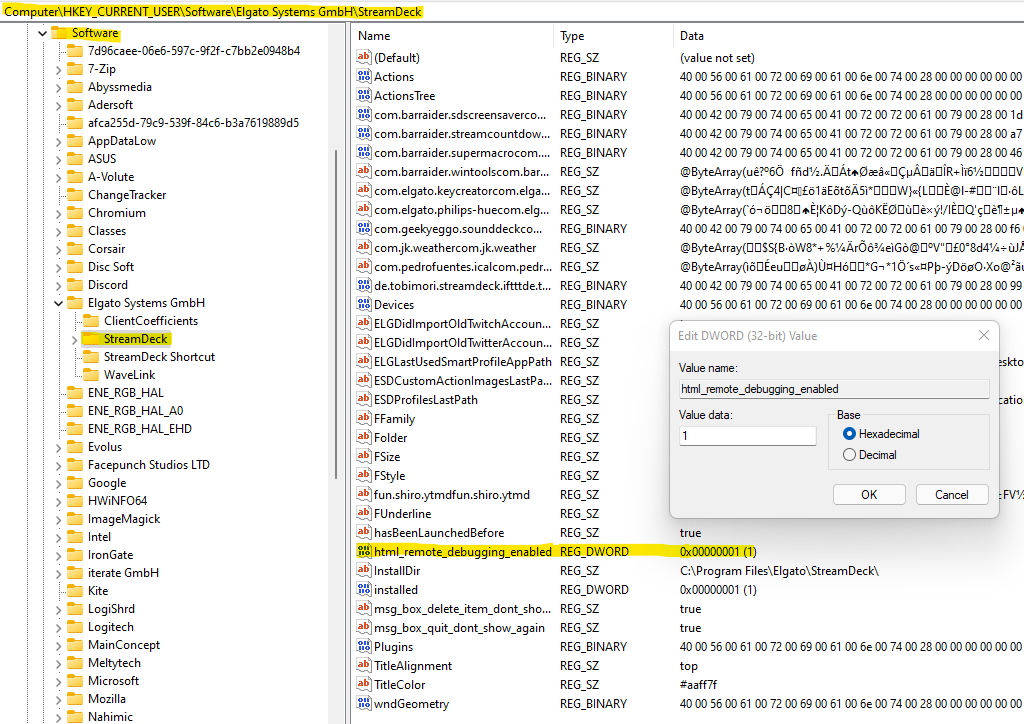
on Windows, you will need to add a DWORD html_remote_debugging_enabled with value 1 in the registry at:
HKEY_CURRENT_USER\Software\Elgato Systems GmbH\StreamDeck
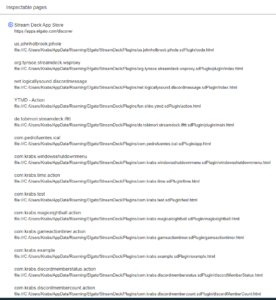
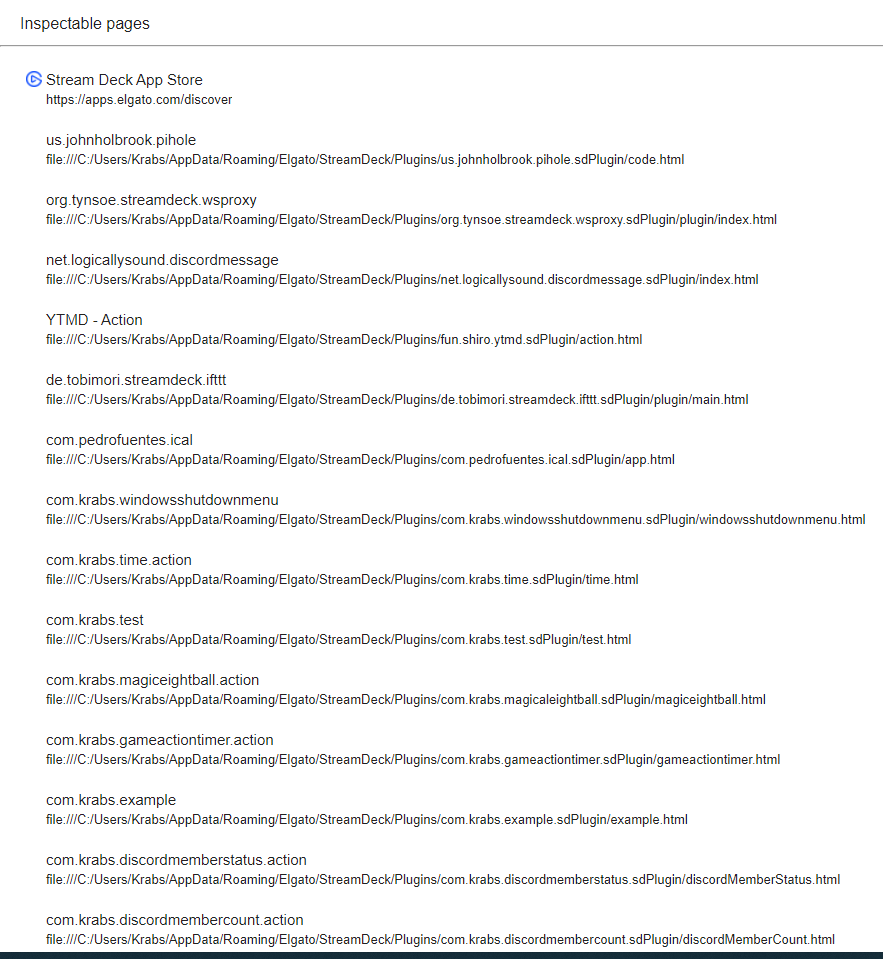
After you relaunch the Stream Deck app, you can open http://localhost:23654/ in Chrome, where you will find a list of ‘Inspectable pages‘ (plugins). Inspecting your plugin is pretty straightforward: Click the reverse DNS name of your plugin and Chrome shows it’s developer tools, where you can further inspect used components and log messages.